# Specify the points for time ( x-axis)
tstart= 1
tfin= 48
stepsize= 1.0
length = (tfin-tstart)/(stepsize+1)
t= tstart
|
|
# Lists for each variable (t = time, g= generated, c= consumed)
import numpy as np
tDomain= np.arange(1,48,1)
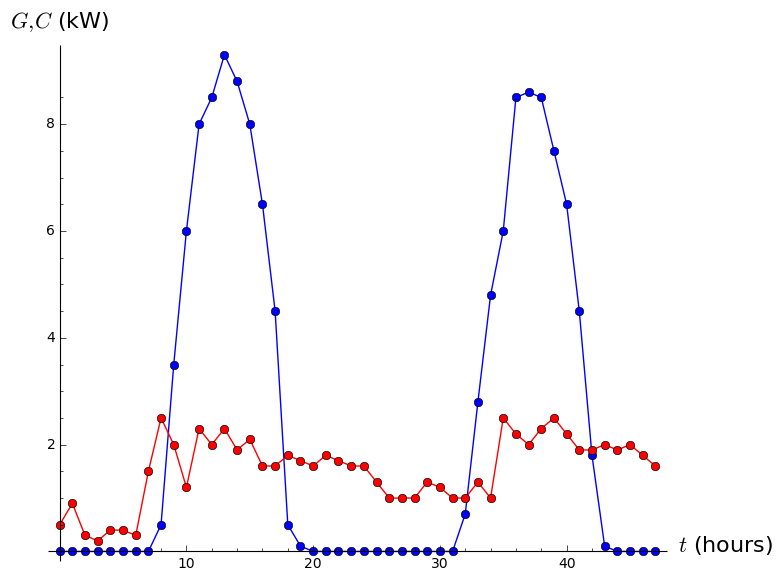
G= [0,0,0,0,0,0,0,0.5,3.5,6.0,8.0,8.5,9.3,8.8,8.0,6.5,4.5,0.5,0.1,0,0,0,0,0,0,0,0,0,0,0,0.7,2.8,4.8,6.0,8.5,8.6,8.5,7.5,6.5,4.5,1.8,0.1,0,0,0,0,0]
C=[0.9,0.3,0.2,0.4,0.3,1.5,2.5,2.0,1.2,2.3,2.0,2.3,1.9,2.1,1.6,1.6,1.8,1.7,1.6,1.8,1.7,1.6,1.6,1.3,1.0,1.0,1.3,1.2,1.0,1.0,1.3,1.0,2.5,2.2,2.0,2.3,2.5,2.2,1.9,2.0,1.9,2.0,1.8,1.6,1.0,1.1,1.2]
Gvalues.append(G)
Cvalues.append(C)
|
|
Gplot=list_plot(list(zip(tDomain,Gvalues)),plotjoined=True,marker='o',color='blue')
Cplot=list_plot(list(zip(tDomain,Cvalues)),plotjoined=True,marker='o',color='red')
show(Gplot+Cplot,axes_labels=['$t$ (hours)','$G,C$ (kW)'])
|
sum (G)- G[0]
124.500000000000 124.500000000000 |
sum (C) - C[0]
77.5000000000000 77.5000000000000 |
np.cumsum(G) #Cumulative Sum at each point, if deltax is 1 for the Riemann Rectangles than the sum can be taken using the y-value from original graph
array([   0. ,    0. ,    0. ,    0. ,    0. ,    0. ,    0. ,    0.5,
          4. ,   10. ,   18. ,   26.5,   35.8,   44.6,   52.6,   59.1,
         63.6,   64.1,   64.2,   64.2,   64.2,   64.2,   64.2,   64.2,
         64.2,   64.2,   64.2,   64.2,   64.2,   64.2,   64.9,   67.7,
         72.5,   78.5,   87. ,   95.6,  104.1,  111.6,  118.1,  122.6,
        124.4,  124.5,  124.5,  124.5,  124.5,  124.5,  124.5])
|
f = np.cumsum(G)
|
|
import matplotlib.pyplot as plt
|
|
np.cumsum(C)
array([  0.9,   1.2,   1.4,   1.8,   2.1,   3.6,   6.1,   8.1,   9.3,
        11.6,  13.6,  15.9,  17.8,  19.9,  21.5,  23.1,  24.9,  26.6,
        28.2,  30. ,  31.7,  33.3,  34.9,  36.2,  37.2,  38.2,  39.5,
        40.7,  41.7,  42.7,  44. ,  45. ,  47.5,  49.7,  51.7,  54. ,
        56.5,  58.7,  60.6,  62.6,  64.5,  66.5,  68.3,  69.9,  70.9,
        72. ,  73.2])
|
x = np.cumsum(G)
y = tDomain
plt.plot(f,y)
plt.show(f,y)
Traceback (click to the left of this block for traceback)
...
ValueError: x and y must have same first dimension
Traceback (most recent call last):
File "<stdin>", line 1, in <module>
File "_sage_input_56.py", line 10, in <module>
exec compile(u"print _support_.syseval(python, u'x = np.cumsum(G)\\ny = tDomain\\nplt.plot(f,y)\\nplt.show(f,y)', __SAGE_TMP_DIR__)" + '\n', '', 'single')
File "", line 1, in <module>
File "/usr/local/sage-6.7/sage/local/lib/python2.7/site-packages/sagenb-0.11.4-py2.7.egg/sagenb/misc/support.py", line 438, in syseval
return system.eval(cmd, sage_globals, locals = sage_globals)
File "/usr/local/sage-6.7/sage/local/lib/python2.7/site-packages/sage/misc/python.py", line 60, in eval
eval(compile(s, '', 'exec'), globals, globals)
File "", line 3, in <module>
File "/usr/local/sage-6.7/sage/local/lib/python2.7/site-packages/matplotlib-1.3.1-py2.7-linux-x86_64.egg/matplotlib/pyplot.py", line 2987, in plot
ret = ax.plot(*args, **kwargs)
File "/usr/local/sage-6.7/sage/local/lib/python2.7/site-packages/matplotlib-1.3.1-py2.7-linux-x86_64.egg/matplotlib/axes.py", line 4137, in plot
for line in self._get_lines(*args, **kwargs):
File "/usr/local/sage-6.7/sage/local/lib/python2.7/site-packages/matplotlib-1.3.1-py2.7-linux-x86_64.egg/matplotlib/axes.py", line 317, in _grab_next_args
for seg in self._plot_args(remaining, kwargs):
File "/usr/local/sage-6.7/sage/local/lib/python2.7/site-packages/matplotlib-1.3.1-py2.7-linux-x86_64.egg/matplotlib/axes.py", line 295, in _plot_args
x, y = self._xy_from_xy(x, y)
File "/usr/local/sage-6.7/sage/local/lib/python2.7/site-packages/matplotlib-1.3.1-py2.7-linux-x86_64.egg/matplotlib/axes.py", line 237, in _xy_from_xy
raise ValueError("x and y must have same first dimension")
ValueError: x and y must have same first dimension
|
len(f)
47 47 |
len(tDomain)
47 47 |
c = np.cumsum(C)
|
|
len(c)
47 47 |
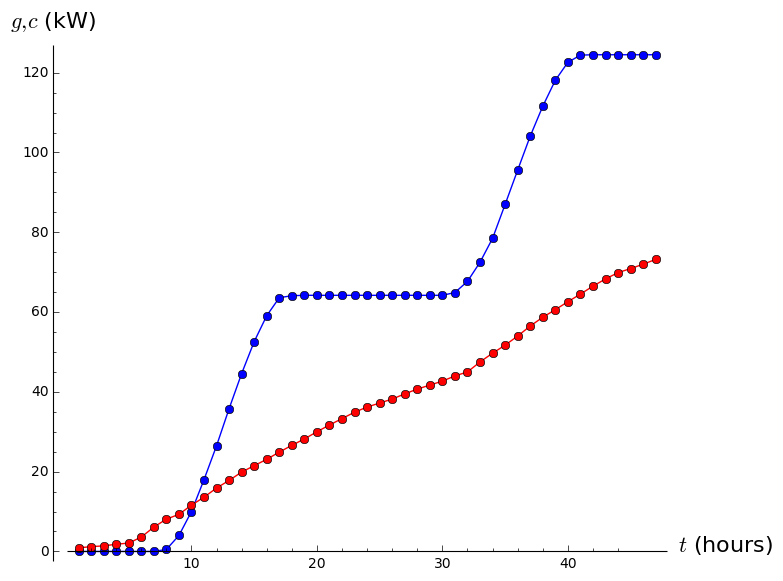
g = [0. , 0. , 0. , 0. , 0. , 0. , 0. , 0.5,
4. , 10. , 18. , 26.5, 35.8, 44.6, 52.6, 59.1,
63.6, 64.1, 64.2, 64.2, 64.2, 64.2, 64.2, 64.2,
64.2, 64.2, 64.2, 64.2, 64.2, 64.2, 64.9, 67.7,
72.5, 78.5, 87. , 95.6, 104.1, 111.6, 118.1, 122.6,
124.4, 124.5, 124.5, 124.5, 124.5, 124.5, 124.5]
c = [0.9, 1.2, 1.4, 1.8, 2.1, 3.6, 6.1, 8.1, 9.3,
11.6, 13.6, 15.9, 17.8, 19.9, 21.5, 23.1, 24.9, 26.6,
28.2, 30. , 31.7, 33.3, 34.9, 36.2, 37.2, 38.2, 39.5,
40.7, 41.7, 42.7, 44. , 45. , 47.5, 49.7, 51.7, 54. ,
56.5, 58.7, 60.6, 62.6, 64.5, 66.5, 68.3, 69.9, 70.9,
72. , 73.2]
|
|
gplot=list_plot(list(zip(tDomain,g)),plotjoined=True,marker='o',color='blue')
cplot=list_plot(list(zip(tDomain,c)),plotjoined=True,marker='o',color='red')
show(gplot+cplot,axes_labels=['$t$ (hours)','$g,c$ (kW)'])
|
|
|