|
|
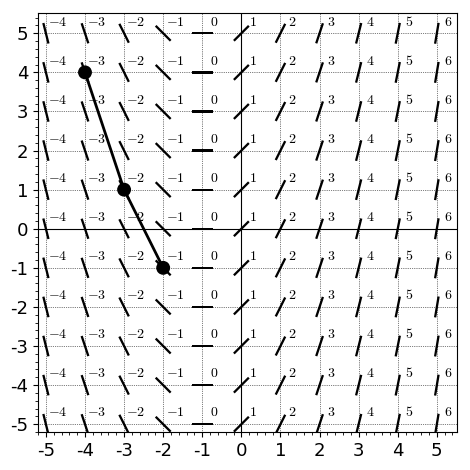
#old exam problem
x,y = var('x y')
G=plot_slope_field(x+1, (x,-5,5), (y,-5,5),plot_points=11)
for m in range(-5,6):
for n in range(-5,6):
v=m+1
G+=text(r'$'+str(v)+'$',(m+0.3,n+0.3),color="black")
G+=point((-4,4),size=100,color="black")
G+=point((-3,1),size=100,color="black")
G+=point((-2,-1),size=100,color="black")
G+=line([(-4,4),(-3,1)],color="black",thickness=2)
G+=line([(-3,1),(-2,-1)],color="black",thickness=2)
G.show(gridlines=[[-5,-4,-3,-2,-1,0,1,2,3,4,5],[-5,-4,-3,-2,-1,0,1,2,3,4,5]],aspect_ratio=1,ticks=[1,1],fontsize=13)
|
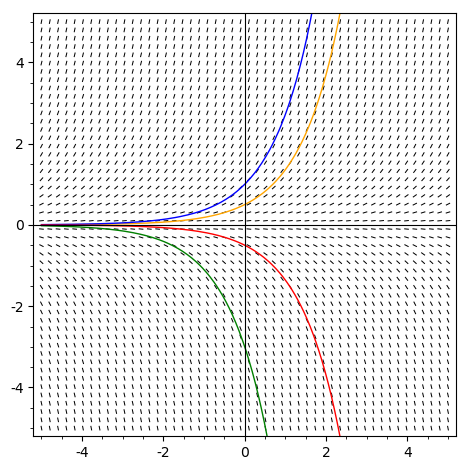
#slope field and solutions to y'=y, exponential
x,y = var('x y')
G=plot_slope_field(y, (x,-5,5), (y,-5,5),plot_points=50)
G+=plot(e^x/2,xmin=-5,xmax=5,ymin=-5,ymax=5,color="orange")
G+=plot(e^x,xmin=-5,xmax=5,ymin=-5,ymax=5,color="blue")
G+=plot(-e^x/2,xmin=-5,xmax=5,ymin=-5,ymax=5,color="red")
G+=plot(-3*e^x,xmin=-5,xmax=5,ymin=-5,ymax=5,color="green")
G.show(aspect_ratio=1)
|
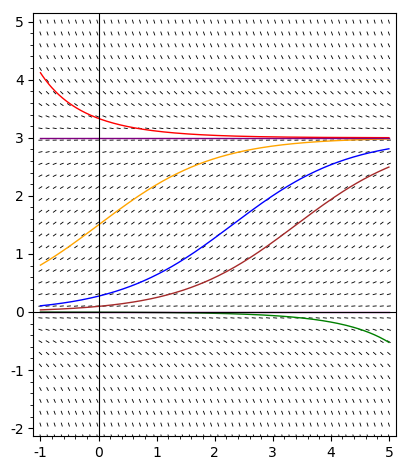
#slope field and solutions for y'=y*(1-y/3), logistic
x,y = var('x y')
G=plot_slope_field(y*(1-y/3), (x,-1,5), (y,-5,5),plot_points=50)
G+=plot(3/(1+e^(-x)),xmin=-1,xmax=5,ymin=-2,ymax=5,color="orange")
G+=plot(3/(1+10*e^(-x)),xmin=-1,xmax=5,ymin=-2,ymax=5,color="blue")
G+=plot(3/(1+30*e^(-x)),xmin=-1,xmax=5,ymin=-2,ymax=5,color="brown")
G+=plot(3/(1-e^(-x)/10),xmin=-1,xmax=5,ymin=-2,ymax=5,color="red")
G+=plot(3/(1-1000*e^(-x)),xmin=-1,xmax=5,ymin=-2,ymax=5,color="green")
G+=plot(3,xmin=-1,xmax=5,ymin=-2,ymax=5,color="purple")
G+=plot(0,xmin=-1,xmax=5,ymin=-2,ymax=5,color="purple")
G.show(aspect_ratio=1)
|
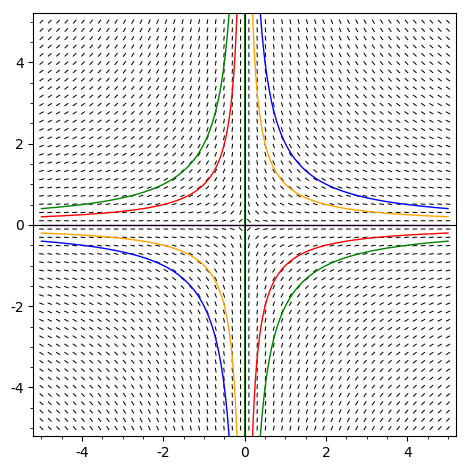
#slope field and solutions to y'=-y/x, hyperbolas
x,y = var('x y')
G=plot_slope_field(-y/x, (x,-5,5), (y,-5,5),plot_points=50)
G+=plot(1/x,xmin=-5,xmax=5,ymin=-5,ymax=5,color="orange")
G+=plot(2/x,xmin=-5,xmax=5,ymin=-5,ymax=5,color="blue")
G+=plot(-1/x,xmin=-5,xmax=5,ymin=-5,ymax=5,color="red")
G+=plot(-2/x,xmin=-5,xmax=5,ymin=-5,ymax=5,color="green")
G+=plot(0,xmin=-5,xmax=5,ymin=-5,ymax=5,color="purple")
G.show(aspect_ratio=1)
|
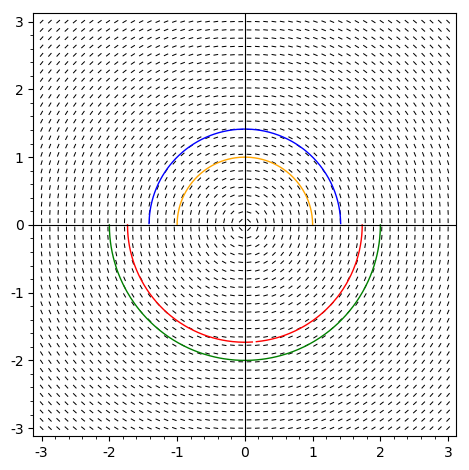
#slope field and solutions to y'=-x/y, circles
x,y = var('x y')
G=plot_slope_field(-x/y, (x,-3,3), (y,-3,3),plot_points=50)
G+=plot(sqrt(1-x^2),xmin=-1,xmax=1,ymin=-3,ymax=3,color="orange")
G+=plot(sqrt(2-x^2),xmin=-sqrt(2),xmax=sqrt(2),ymin=-3,ymax=3,color="blue")
G+=plot(-sqrt(3-x^2),xmin=-sqrt(3),xmax=sqrt(3),ymin=-3,ymax=3,color="red")
G+=plot(-sqrt(4-x^2),xmin=-2,xmax=2,ymin=-3,ymax=3,color="green")
G.show(aspect_ratio=1)
|
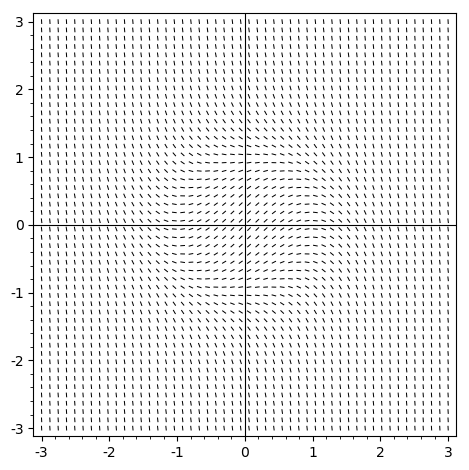
#slope field for y'=1-x^2-y^2
x,y = var('x y')
G=plot_slope_field(1-x^2-y^2, (x,-3,3), (y,-3,3),plot_points=50)
G.show(aspect_ratio=1)
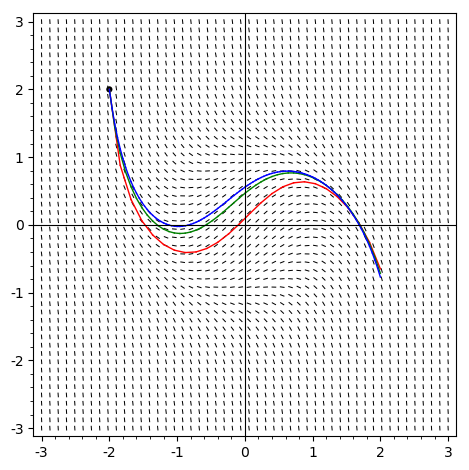
#euler's method
#initial condition (-2,2)
xold=-2
yold=2
#marking the starting point
G+=point((-2,2),color="black",size=20)
#number of steps and step size h
steps=25
h=4.0/steps
for n in range(steps):
#increment xold
xnew=xold+h
#change yold based on the slope at (xold,yold)
ynew=yold+(1-xold^2-yold^2)*h
#draw a line between (xold,yold) and (xnew,ynew)
G+=line([(xold,yold),(xnew,ynew)],color="red")
#set xnew and ynew to xold and yold
xold=xnew
yold=ynew
#repeating with 50 steps
#initial condition (-2,2)
xold=-2
yold=2
steps=50
h=4.0/steps
for n in range(steps):
#increment xold
xnew=xold+h
#change yold based on the slope at (xold,yold)
ynew=yold+(1-xold^2-yold^2)*h
#draw a line between (xold,yold) and (xnew,ynew)
G+=line([(xold,yold),(xnew,ynew)],color="green")
#set xnew and ynew to xold and yold
xold=xnew
yold=ynew
#repeating with 100 steps
#initial condition (-2,2)
xold=-2
yold=2
steps=100
h=4.0/steps
for n in range(steps):
#increment xold
xnew=xold+h
#change yold based on the slope at (xold,yold)
ynew=yold+(1-xold^2-yold^2)*h
#draw a line between (xold,yold) and (xnew,ynew)
G+=line([(xold,yold),(xnew,ynew)],color="blue")
#set xnew and ynew to xold and yold
xold=xnew
yold=ynew
G.show(aspect_ratio=1)
#close up near the starting point
G.axes_range(-2,-3/2,-1/2,2)
G.show()
|
|
|